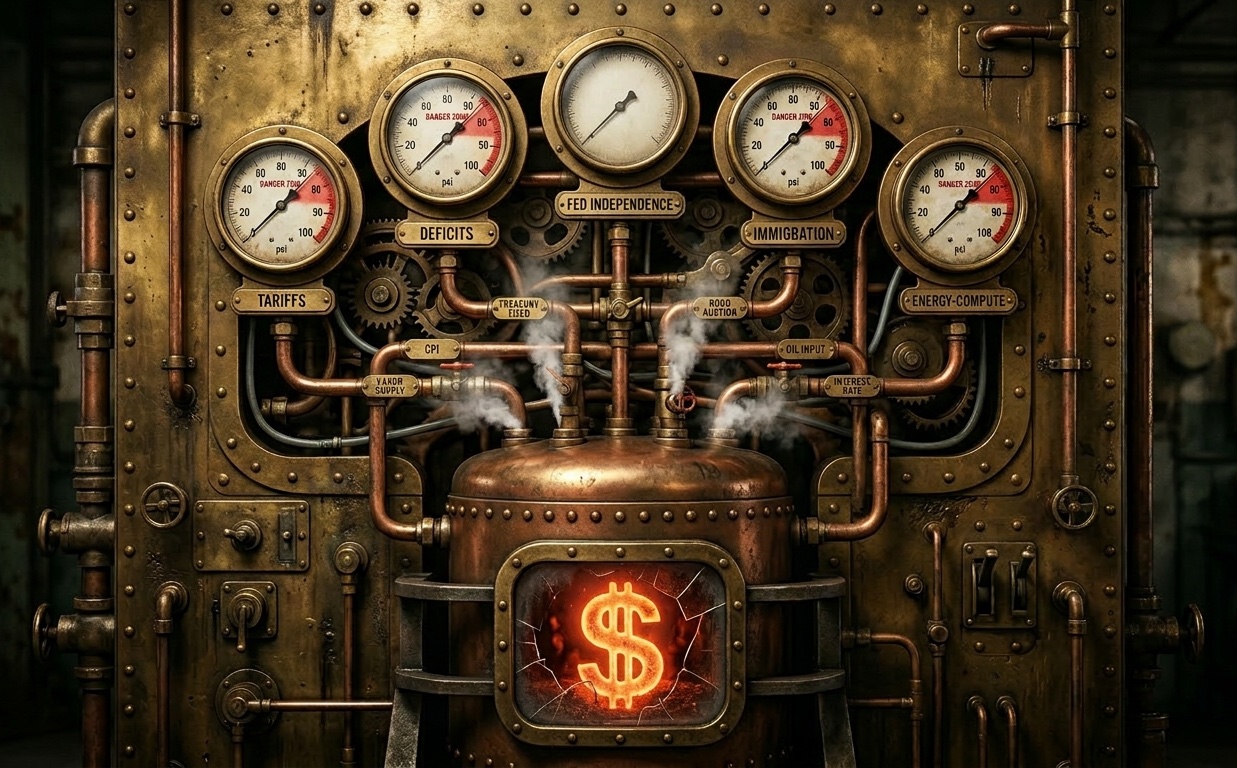
The Receipt
Five numbers. Read them as a set.
| Gauge | Reading | Context |
|---|---|---|
| Effective tariff rate | 10.3% | Highest since 1947. April 2025 peak of 27% exceeded Smoot-Hawley. |
| Federal deficit | $1.9T / 5.8% GDP | Widest peacetime deficit in history. Interest alone: $970B/year. |
| Fed independence | Criminal investigation | First time in the Fed's 112-year history. |
| Net immigration | –10K to –295K | First negative reading in at least half a century. |
| Data center energy | 183 TWh / 4%+ | On track to exceed all U.S. residential consumption by 2026. |
Every gauge has a team. The trade team reads tariffs. The Fed watchers read monetary policy. The immigration analysts read labor data. The energy analysts read demand curves. Each team publishes reports, convenes panels, issues warnings about their gauge and their gauge alone.
Every team is right about their gauge. Not one of them is reading all five.
Here is the feedback loop:
Tariffs raise import prices → immigration restriction removes the labor force that held domestic prices down → inflation compounds from both ends → the Fed cannot cut → the administration pressures the Fed to cut anyway → credibility erodes → the bond market demands higher yields → higher yields raise the cost of servicing $30.6 trillion in Treasury debt → the deficit widens → energy costs spike on AI demand → tariffs make solar panels 54–85% more expensive → the productivity miracle that was supposed to justify rate cuts cannot arrive in time
I call this the five-gauge feedback loop: structural feedback running through institutions designed to read one signal at a time. The data is public. The connections are arithmetic. Every pipe is traceable in numbers published by the CBO, the BLS, the IEA, the Penn Wharton Budget Model, and the Federal Reserve's own FRED database.
FRED DGS10 (10-year yield), DGS2 (2-year yield), T10YIE (breakeven inflation), FEDFUNDS (fed funds rate). CBOE MOVE Index (bond volatility), VIX (equity volatility). Pull them up. Each one is a reading on this machine.
This article traces the pipes.
I. The Tariff Gauge
On February 20, 2026, the Supreme Court struck down the administration's use of the International Emergency Economic Powers Act to impose tariffs. Chief Justice Roberts, writing for a 6-3 majority, held that "the power to 'regulate... importation' is distinct from the power to tax, which is the unique prerogative of Congress." Within hours, the administration pivoted to Section 122 of the Trade Act of 1974, imposing a 10 percent surcharge, raised to 15 percent two days later, the statutory maximum. These replacement tariffs expire automatically in 150 days.
The legal drama obscures the structural reality. Before the Supreme Court ruling, the effective tariff rate had reached 10.3 percent, the highest since at least 1947, according to the Penn Wharton Budget Model. At its pre-ruling peak in April 2025, the rate briefly touched 27 percent, exceeding the Smoot-Hawley tariffs that helped deepen the Great Depression. Steel and aluminum face a 41.1 percent effective rate. Automobiles face 25 percent tariffs that add an estimated $4,000 to the price of a new car.
U.S. effective tariff rate, 1940–present. The spike is visible from orbit.
The Yale Budget Lab has calculated the aggregate cost: all 2025 tariffs, accounting for foreign retaliation, reduce real GDP by 0.6 percent permanently, the equivalent of $160 billion annually in lost economic output. Exports are 18.1 percent lower. The Tax Foundation estimates the tariffs amount to an average tax increase of $1,500 per American household in 2026.
The revenue side tells its own story. The administration collected $209 billion in new customs revenue between January 2025 and January 2026, a 250 percent increase over the prior year. The number sounds large until you set it against the cost. Over a decade, the Tax Foundation calculates that the economic contraction reduces net tariff revenue by $145 billion. And the Penn Wharton Budget Model estimates the government may owe up to $175 billion in refunds for tariffs collected under the now-unconstitutional IEEPA authority.
The tariff gauge doesn't just register its own pressure. It feeds directly into the inflation pipe. The Congressional Budget Office projects tariff policies will increase the average annual inflation rate by roughly 0.4 percentage points through 2026. The Peterson Institute for International Economics warns inflation could exceed 4 percent by year-end. Core PCE inflation, the measure the Federal Reserve watches most closely, is already running at 2.8 percent, stubbornly above the Fed's 2 percent target.
Core PCE, 2020–present. The 2% target line is where the Fed says it wants to be. The actual line is where tariffs won't let it go.
And inflation is the pipe that connects the tariff gauge to the next one.
II. The Fed Independence Gauge
Jerome Powell's term as Federal Reserve Chair expires on May 15, 2026. The administration has nominated Kevin Warsh to replace him. Warsh is a former Fed governor, Hoover Institution fellow, and Stanford lecturer. The nomination was sent to the Senate on March 4, 2026.
What makes this transition extraordinary is not the nominee. It is the context.
On January 11, 2026, Powell disclosed that the Department of Justice had served the Federal Reserve with grand jury subpoenas, opening a criminal investigation ostensibly related to his testimony about a headquarters renovation project. Powell's response was extraordinary in its directness: "This unprecedented action should be seen in the broader context of the administration's threats and ongoing pressure.... This is about whether the Fed will be able to continue to set interest rates based on evidence and economic conditions — or whether instead monetary policy will be directed by political pressure or intimidation."
A federal judge subsequently tossed the subpoenas, accusing the administration of using the criminal investigation to pressure the head of the world's most important central bank to lower interest rates, and finding "no evidence whatsoever" that Powell had committed a crime. The DOJ has appealed. U.S. Attorney Jeanine Pirro called the ruling "outrageous."
This is not the only front. In August 2025, the administration attempted to fire Fed Governor Lisa Cook, a Biden appointee, after Peter Pulte accused her of mortgage fraud and referred the matter to the DOJ. This was the first time a sitting president has tried to remove a standing Federal Reserve governor. The president has publicly demanded Powell resign ("That jerk will be gone soon") and proposed what he calls "THE TRUMP RULE": lower interest rates regardless of market conditions.
The nominee, Warsh, has more recently argued for greater policy easing, asserting that productivity gains from AI will allow the economy to grow without spurring inflation, a position that aligns with the administration's desire for rate cuts. His confirmation, however, faces an obstacle: Senator Thom Tillis, a North Carolina Republican on the Senate Banking Committee, has vowed to block any Fed nomination until the DOJ drops its investigation of Powell.
The financial system understands what this means. Morgan Stanley has warned that if the Fed lowers rates below levels justified by economic data, it could stoke fears about long-term inflation and erode credibility, resulting in lower bond prices and higher long-term yields. The term premium, the compensation investors demand for holding longer-dated bonds, has already increased as markets price in institutional uncertainty, enormous debt refinancing needs, and challenges to Fed independence.
10-Year Term Premium, 2020–present. This is the market's price tag on institutional uncertainty.
The pipe from the Fed independence gauge runs straight to the deficit gauge.
What Happens When You Capture the Central Bank
We do not need to speculate about outcomes. The historical record is unambiguous.
Nixon and Burns, 1972. President Nixon met with Federal Reserve officials 160 times, compared to 6 meetings during the Clinton administration. He urged Chairman Arthur Burns to "start expanding the money supply," planted a false story that Burns was requesting a large pay raise, and proposed expanding the Fed's board so he could appoint a sympathetic majority. Burns accommodated. The resulting monetary expansion helped produce the inflationary boom of 1973-74, with CPI reaching 9.6 percent. Breaking the inflation Nixon's pressure had ignited took Paul Volcker's brutal rate hikes and two recessions.
Erdogan and the Turkish Central Bank, 2019-2023. President Erdogan fired three central bank governors in less than two years. When Governor Naci Ağbal raised rates to 19 percent, the orthodox response to rising inflation, Erdogan replaced him with a newspaper columnist who shared his conviction that high interest rates cause inflation. The central bank then cut rates from 19 percent to 8.5 percent. The result: inflation hit a 24-year high above 85 percent in October 2022. The lira lost approximately 80 percent of its value against the dollar. Gürkaynak, Kısacıkoğlu, and Lee's study in the Economic Journal concluded that standard macroeconomic models predicted the disaster accurately. Turkey's experiment was not a mystery. It was a demonstration.
Argentina, 2012-2023. Argentina's central bank statutes were reformed in 2012 to erode independence, enabling political credit allocation and seigniorage financing. By 2023, inflation reached 143 percent. Fifty-five percent of Argentine children lived below the poverty line. When Milei took office in December 2023, he inherited net central bank reserves of negative $6 billion. The institution had been hollowed from within.
The common pattern: political capture of the central bank produces short-term rate accommodation, which produces inflation, which produces higher long-term yields, which increases the cost of servicing sovereign debt, which widens the deficit, which creates further pressure on the central bank. The feedback loop is not theoretical. It has been run three times in the last fifty years, each time producing the same result.
III. The Deficit Gauge
The federal deficit for fiscal year 2026 is projected at $1.9 trillion, 5.8 percent of GDP. The gross national debt reached $38.6 trillion as of February 2026, increasing at $8.03 billion per day.
But the number that matters most is not the debt itself. It is the interest on the debt. In fiscal year 2025, the federal government paid $970 billion in interest, 19 percent of all federal revenue. In fiscal year 2026, interest payments will cross $1 trillion for the first time, making net interest the third-largest government expenditure, behind only Social Security and Medicare. Over the next decade, the CBO projects $16.2 trillion in cumulative interest costs.
Federal surplus or deficit as % of GDP, 1960–present. The trendline is what matters: structural deficit outside of any recession.
The arithmetic is relentless. Every basis point increase in the yield curve raises the cost of rolling over existing debt. Treasury securities outstanding have reached $30.6 trillion, up 6.9 percent year-over-year. The federal government is the largest borrower on Earth, and its cost of borrowing is set by the very bond market that is watching the other gauges.
On May 16, 2025, Moody's downgraded the United States' sovereign credit rating from Aaa to Aa1, citing deteriorating fiscal health. Moody's was the last major rating agency to maintain a perfect credit rating for the U.S., a status it had upheld since 1917. S&P had already downgraded in August 2011; Fitch followed in August 2023. The downgrade club now has unanimous membership.
The bond market's response has been measurable. The 10-year Treasury yield surged from 3.97 percent in late February to 4.28 percent by mid-March 2026, a 31 basis point jump in about two weeks. One-year U.S. credit default swap spreads tripled from 16 basis points at the start of 2025 to 52 basis points by May. China reduced its Treasury holdings to $688.7 billion in October 2025, the lowest since November 2008, down more than 47 percent from its 2013 peak. China shed $86 billion in Treasuries in a single year, diversifying into gold.
Bond market volatility, 2022–present. This is the bond market's VIX. When it spikes, the plumbing is stressed. Overlay with tariff announcement dates.
Analysts describe this as the emergence of "fiscal dominance": the condition where the government's borrowing needs begin to dictate long-term interest rates, overriding monetary policy. When the deficit is large enough, even an independent central bank cannot prevent yields from rising, because the supply of new debt overwhelms demand. When the central bank is not independent, when it is pressured to hold rates low despite fiscal reality, the result is not low rates. The result is that the bond market imposes the discipline the central bank will not.
We saw this in September 2022, when Liz Truss's government announced £45 billion in unfunded tax cuts. The 30-year gilt yield spiked 120 basis points in three days. Pension funds holding liability-driven investment products, £1.6 trillion in hidden leverage, faced cascading margin calls that forced gilt sales that drove yields higher that triggered more margin calls. The Bank of England intervened with £65 billion in authorized gilt purchases. Truss lasted 49 days, the shortest tenure of any British Prime Minister in history.
Meanwhile, in the shadow plumbing that most gauge-watchers never check: the Financial Stability Board reports that global nonbank financial intermediation, the shadow banking system, reached $256.8 trillion in assets in 2024, comprising 49.1 percent of global financial assets. The Congressional Research Service notes that hedge fund leverage in the Treasury basis trade has reached levels that could amplify any bond market dislocation into a systemic event. This is the pipe behind the pipe: the one that turns a bond market repricing into a liquidity crisis.
Hedge fund leverage in Treasury futures is the accelerant no one marks on their gauge. April 2025.
The bond market doesn't bluff. And it is watching the next gauge.
IV. The Immigration Gauge
In 2025, net immigration to the United States went negative for the first time in at least half a century. The Brookings Institution estimated net immigration between negative 10,000 and negative 295,000, a swing of nearly 1.4 million people from the CBO's prior projections.
The human toll of mass deportation and enforcement actions is documented elsewhere. What matters for the machine behind the wall is the economic plumbing.
Sixty-eight percent of U.S. farm laborers are foreign-born. Forty-two percent of crop farmworkers are undocumented. The Department of Labor has documented what it calls "a persistent and systemic lack" of U.S. workers willing to do this work. Agricultural employment dropped by 155,000 workers between March and July 2025, a period that normally sees increases. Immigrants comprise 30 percent of the construction workforce; the ten states with the highest concentration of undocumented construction workers saw employment decline 0.1 percent while other states saw 1.9 percent growth. Food service workers have experienced more than 7 percent annualized earnings growth since 2020, driven by labor constraints and strong demand.
Farm employment, seasonally adjusted, 2023–present. The seasonal pattern breaks in 2025.
The CBO has calculated what this labor force represents in fiscal terms. The immigration surge of 2021-2026 was projected to increase nominal GDP by $8.9 trillion over the decade, generate $788 billion in income and payroll taxes, and reduce federal deficits by $0.9 trillion. Goldman Sachs has estimated that Trump immigration policies would slash the workforce by 15.7 million and slow GDP growth by a third over the next decade.
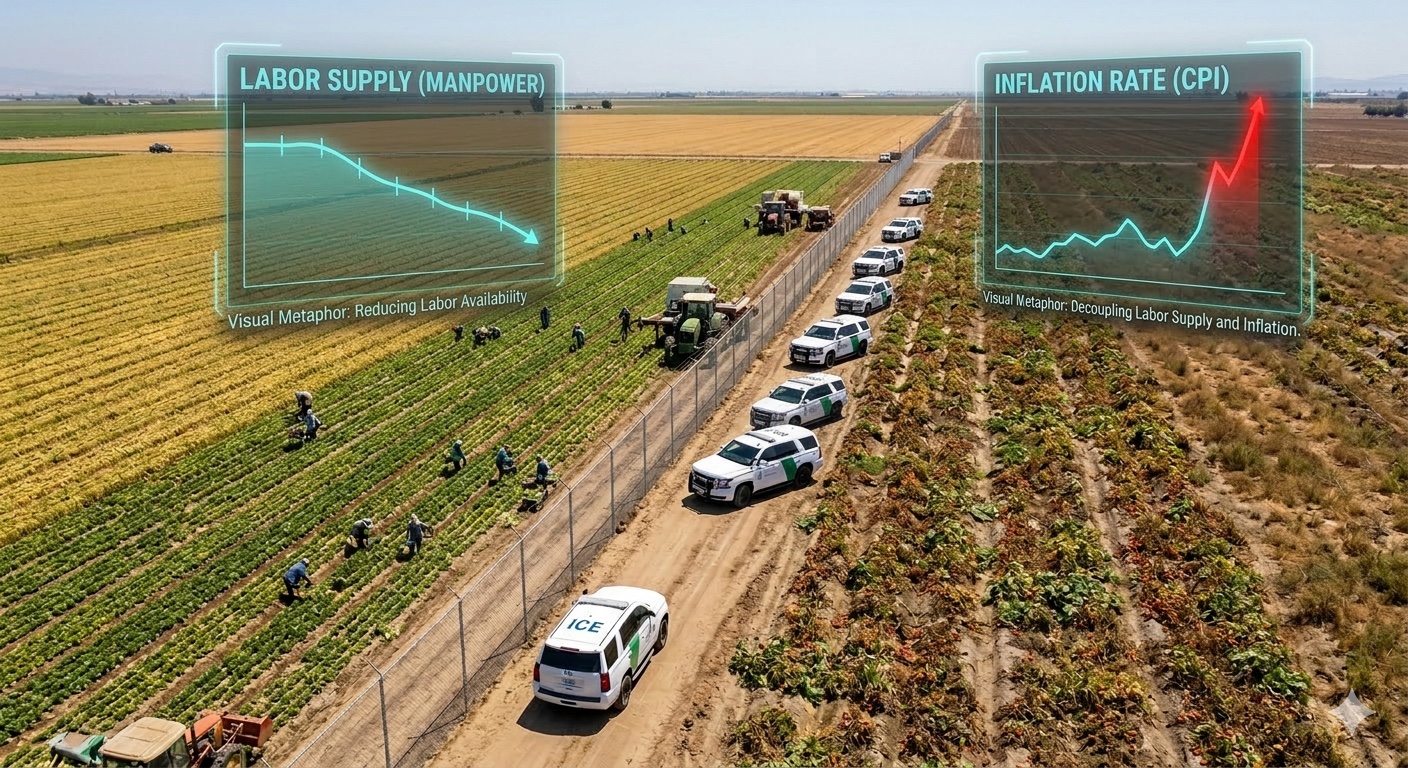
Here is the pipe that the five teams of experts do not see: removing the workers who suppress wage inflation in tariff-sensitive sectors (agriculture, construction, food service) compounds the inflationary pressure from the tariffs themselves. The tariff gauge and the immigration gauge are connected by the labor market. Tariffs raise the price of imported goods. Immigration restriction raises the price of domestic labor in the sectors that produce and distribute those goods. The two pressures converge at the same point: inflation. And inflation is what constrains the Fed, the gauge whose independence is under the most direct assault in modern American history.
The CBO calculates the direct GDP effect of reduced immigration at 0.2 percentage points in 2025 and 0.1 percentage point in 2026. These numbers sound small. They are not. When the deficit is already $1.9 trillion and rising, every tenth of a percentage point of lost GDP growth represents billions in lost tax revenue, revenue that could have reduced the borrowing that is driving the interest payments that are consuming 19 percent of the federal budget.
V. The Energy-Compute Gauge
This is the gauge most institutional dashboards don't include. It should be the first one they check.
U.S. data centers consumed 183 terawatt-hours of electricity in 2024, more than 4 percent of total U.S. consumption. The International Energy Agency projects this will reach 260 terawatt-hours by 2026, a 42 percent increase in two years. The Energy Information Administration expects data centers to exceed residential electricity consumption for the first time in 2026.
The numbers are staggering at every scale. Hyperscaler capital expenditure, the spending by Amazon, Alphabet, Microsoft, Meta, and Oracle, is projected to exceed $600 billion in 2026, a 36 percent increase over 2025. Roughly 75 percent, or $450 billion, goes directly to AI infrastructure. UBS projects as much as $900 billion in new corporate debt in 2026; Morgan Stanley and JPMorgan estimate the technology sector may need $1.5 trillion in new debt over the next few years to finance AI and data center construction.
$602B capex, $37B revenue. The 17:1 gap is the trade of the decade, or the write-off.
Now connect the pipes. Every dollar of that debt is sensitive to interest rates. The century bond that Alphabet issued in February 2026, the first by a technology company since Motorola in 1997, prices a century of technological uncertainty as calculable financial risk. The GPUs it funds will be in a recycling facility within five years. The revenue required to justify the industry's $602 billion in annual capex is $650 billion, seventeen times the $37 billion in current AI revenue, a gap JPMorgan calculates would require $34.72 per month from every iPhone user on Earth, in perpetuity, to close.
Frank Knight drew the line in 1921: risk is measurable; uncertainty is not. The financial system has reclassified Knightian uncertainty as calculable risk to process it within existing pricing models. The 100-year bond is priced. It traded. It was oversubscribed five times. None of this means the uncertainty has been resolved. It means the uncertainty has been reclassified. The reclassification is itself a bet that the bond market will be asked to evaluate when the revenue doesn't arrive.
And here is where the energy-compute gauge connects to the other four: the AI infrastructure thesis assumes abundant, affordable energy for decades. Tariffs make solar panels 54 to 85 percent more expensive to install in the United States than in China. Electric bills rose 7 percent in 2025; natural gas bills rose 11 percent. Goldman Sachs projects electricity prices will continue rising on AI data center demand. The U.S. is, as Marketplace reported in February, "losing the AI energy race to China," because China can build energy infrastructure faster and cheaper, partly because it is not imposing tariffs on its own supply chain.
The administration's own Fed chair nominee, Kevin Warsh, argues that AI productivity gains will allow the economy to grow without spurring inflation, the justification for the rate cuts the administration wants. But the energy costs that make AI infrastructure viable are rising because of the tariffs the administration imposed. The productivity miracle that is supposed to unlock lower rates is being sabotaged by the trade policy that precedes it.
Average electricity price per kWh, 2019–present. Overlay with data center capacity additions (IEA). The demand curve and the cost curve are diverging.
The tariff gauge, the energy-compute gauge, and the Fed gauge form a triangle of mutual interference that no single team of experts can see, because each team is staring at only one instrument.
VI. The Machine Behind the Wall
So here is the question that every quant, every trader, every policy analyst should be asking: if the pipes between the gauges are traceable in public data, if the feedback loop is arithmetic, why can't the institutions that monitor each gauge see the machine?
Mark Blyth has spent two decades studying this question from the political economy side. In Great Transformations (2002), he documented a pattern that runs through every major economic crisis of the twentieth century: the categories we use to organize economic debate are not neutral descriptions of reality. They are ideas functioning as institutional weapons, deployed by actors who benefit from specific framings, maintained by professional incentives, and defended most fiercely precisely when they are most misleading.
The five gauges are separated by ideas. "Trade policy." "Monetary policy." "Immigration enforcement." "Energy regulation." "Technology investment." These are not natural categories. They are institutional architectures that determine who is qualified to speak, what data counts as relevant, and, critically, what connections are invisible.
Blyth would point to the political function of the separation: the tariff advocate does not want the tariff debate connected to inflation, because the connection weakens the case for tariffs. The immigration restrictionist does not want the labor debate connected to the deficit, because the connection reveals fiscal costs. The Fed critic does not want rate policy connected to the bond market, because the connection shows the price of political pressure. The tech evangelist does not want the energy debate connected to trade policy, because the connection reveals that the AI productivity miracle has a tariff problem.
Each separation benefits someone. The ideas that maintain the separation are not descriptions. They are load-bearing structures in the political architecture of denial. As Blyth argued in Austerity (2013), you can run an economy on narratives about the economy, but not forever. At some point, material reality reasserts itself against the ideas used to manage it. The five-gauge feedback loop is that reassertion.
Niklas Luhmann, the German systems theorist, provided the structural explanation for Blyth's political observation. Modern society, Luhmann argued, is organized into functional subsystems, including law, politics, economy, science, and education, each operating through its own binary code. The economic system processes everything through payment/non-payment. The legal system processes everything through legal/illegal. The political system processes everything through power/non-power. Each system is extraordinarily sophisticated within its own code. And each system is structurally blind to everything that falls outside it.
"Every system uses its own distinction to observe the world," Luhmann wrote. "The system cannot observe what it cannot observe. It cannot observe that it cannot observe this. It is blind to its own blind spot."
The tariff experts operate in the trade code. They can tell you the effective rate on every product category, model the welfare costs, trace the supply chain rerouting. They cannot tell you what tariff-driven inflation does to the Fed's rate calculus, because that is the monetary code. The Fed watchers operate in the monetary code. They can parse dot plots, model yield curves, assess term premium. They cannot tell you what rate policy does to the construction labor market, because that is the labor code. The immigration analysts operate in the labor code. They can document workforce composition, wage trends, sector-level employment data. They cannot tell you what labor shortages do to AI infrastructure costs, because that is the technology code.
Every code-cage is staffed by experts. Every expert is right about their gauge. And the machine behind the wall, the feedback loop that connects all five, is invisible from inside any single cage.
Blyth names the political interest that maintains the cages. Luhmann names the structural mechanism that locks them. Jürgen Habermas, Luhmann's great intellectual rival, identified the force that keeps them locked.
The "steering media" of modern society, money and power, have colonized what Habermas called the "lifeworld": the domain of shared understanding, communicative reason, democratic deliberation. The system rewards code-compliant micro-transactions. The trade lawyer who structures tariff arbitrage through Vietnam is operating within legal/illegal. The banker who prices the century bond is operating within payment/non-payment. The congressional staffer who drafts the Section 122 replacement tariff is operating within power/non-power. Each actor is rewarded for staying inside their code. No actor is rewarded for seeing across codes. Peter Verovšek, writing in Political Studies in 2023, applied Habermas's colonization thesis directly to post-2008 economic governance: "The whole program of subordinating the lifeworld to the imperatives of the market must be subjected to scrutiny." The scrutiny never came.
Lawrence Lessig, the legal scholar whose Code and Other Laws of Cyberspace established the framework for understanding how architecture regulates behavior, would recognize this as regulatory failure across all four of his modalities. Law cannot contain the feedback loop because the loop crosses jurisdictional boundaries: trade law, monetary policy, immigration enforcement, energy regulation, and securities law each govern one gauge. Norms cannot contain it because the professional norms in each field reward specialization. Markets cannot contain it because the market is the loop: the bond market's reaction to tariff-driven inflation is not a correction of the loop; it is a reading on one of the gauges. And architecture, the design of the institutional system itself, is what makes the loop invisible: the institutional architecture separates each gauge into a different agency, a different committee, a different body of expertise.
The loop runs through all four modalities and is governed by none.
Four Thinkers — One Diagnosis
- Blyth: The separation benefits specific actors. The ideas that maintain it are political weapons, not neutral categories.
- Luhmann: The separation is structurally embedded in functional differentiation. Each code is blind to what it cannot process.
- Habermas: The steering media of money and power reward code-compliance and punish cross-code observation.
- Lessig: The institutional architecture, spanning law, norms, markets, and code, is designed to govern one gauge at a time. No modality governs the feedback loop.
They are describing the same machine from four angles. The machine doesn't care which angle you prefer. It runs.
VII. The Question That Matters
There is a moment in every feedback loop when the pressures compound past the point of linear response. Engineers call it a phase transition. Economists call it a regime change. Historians call it, after the fact, obvious.
We are not predicting a crisis. Structural diagnosis is not forecasting. We are describing a configuration: a specific arrangement of pressures, instruments, institutions, and incentives that has emerged in documented time, measured in public data, and that connects gauges the institutional architecture was designed to keep separate.
The tariffs raise prices. The immigration crackdown removes the workers who held prices down. The combined inflation constrains the Fed. The administration pressures the Fed to cut rates anyway. The Fed's credibility, the only thing that keeps $30.6 trillion in Treasury debt priced at current levels, erodes. The bond market responds by demanding higher yields. Higher yields increase the cost of servicing the deficit. The deficit widens. The energy costs that could unlock the AI productivity miracle rise because tariffs make the equipment more expensive. The productivity miracle that was supposed to justify the rate cuts doesn't arrive in time.
Meanwhile, the shadow banking system amplifies every tremor in the bond market through leveraged positions that no gauge-watching team is tasked with monitoring. It holds $256.8 trillion in nonbank financial assets, nearly half the world's financial system.
DGS10, T10YIE, FEDFUNDS, MOVE, VIX, all on one screen. This is the machine.
This is one machine. The teams staring at each gauge cannot see it, because seeing it would require a code that their professional training, institutional incentives, and career structure do not reward, and because the ideas that maintain the separation, as Blyth would remind us, are not neutral. They serve interests. They reduce uncertainty for the actors inside each cage by making the connections between cages invisible.
The 1,028 economists who petitioned Herbert Hoover in 1930 to veto the Smoot-Hawley Tariff Act understood something about feedback loops. They warned that retaliatory tariffs would collapse international trade, which fell 60 percent over the following five years. U.S. exports dropped from $7 billion in 1929 to $2.5 billion in 1932. Douglas Irwin's quantitative assessment, published through the National Bureau of Economic Research, estimates the Smoot-Hawley tariff alone reduced U.S. GNP by approximately 2 percent.
Trade was 5 percent of U.S. GDP in 1930. It is 25 percent today.
The question is not whether any individual gauge is in the danger zone. The question is what happens when all five gauges are connected to the same boiler, and no one is watching the boiler.
You can't run an economy on narratives about the economy forever.
Sources
Tariff Data
- Penn Wharton Budget Model. "Effective Tariff Rates and Revenues (Updated March 16, 2026)." Wharton School, University of Pennsylvania.
- Yale Budget Lab. "Where We Stand: The Fiscal, Economic, and Distributional Effects of All U.S. Tariffs." Yale University.
- Tax Foundation. "Tariff Tracker: 2026 Trump Tariffs & Trade War by the Numbers."
- Congressional Budget Office. "Budgetary and Economic Effects of Increases in Tariffs." June 2025.
- Peterson Institute for International Economics. "The Risk of Higher US Inflation in 2026."
- WilmerHale. "Supreme Court Strikes Down IEEPA Tariffs: What Now." February 20, 2026.
Federal Deficit and Debt
- Congressional Budget Office. "The Budget and Economic Outlook: 2026 to 2036." February 2026.
- U.S. Congress Joint Economic Committee. "National Debt Hits $38.43 Trillion." January 2026.
- Peter G. Peterson Foundation. "Monthly Interest Tracker."
- Committee for a Responsible Federal Budget. "Debt Rises to 175% of GDP." March 2, 2026.
- Moody's Investors Service. "Rating Action: Downgrades United States to Aa1." May 16, 2025.
Federal Reserve Independence
- Federal Reserve Board. "Statement from Chair Jerome H. Powell." January 11, 2026.
- CNN Business. "Federal Prosecutors Open Criminal Investigation into the Fed." January 11, 2026.
- CNBC. "Trump Officially Nominates Kevin Warsh as Fed Chair." March 4, 2026.
- Axios. "Federal Judge Tosses Subpoenas Against Fed Chair Powell." March 13, 2026.
- Atlantic Council. "Trump's Challenges to the Fed's Independence." August 2025.
- Anne O. Krueger, Project Syndicate. "The Costs of Politicizing Monetary Policy." January 2026.
Historical Parallels
- Abrams, Burton A. "How Richard Nixon Pressured Arthur Burns." Journal of Economic Perspectives 20, no. 4 (2006).
- Gürkaynak, Kısacıkoğlu, and Lee. "Exchange Rate and Inflation under Weak Monetary Policy: Turkey Verifies Theory." Economic Policy 38, no. 115 (2023).
- Carnegie Endowment. "Why Is Turkey's President Cutting Interest Rates?" December 2021.
- Becker Friedman Institute. "The Case of Argentina." University of Chicago.
- Bank of England. "What Caused the LDI Crisis?" Bank Underground, July 2024.
- Irwin, Douglas A. "The Smoot-Hawley Tariff: A Quantitative Assessment." NBER Working Paper, 1996.
- U.S. State Department, Office of the Historian. "Protectionism in the Interwar Period."
Immigration and Labor
- Brookings Institution. "Macroeconomic Implications of Immigration Flows." January 2026.
- Congressional Budget Office. "Effects of the Immigration Surge on the Federal Budget." June 2025.
- American Enterprise Institute. "Immigration Enforcement and the US Agricultural Sector." 2025.
- Economic Policy Institute. "Trump's Deportation Agenda Will Destroy Millions of Jobs." 2025.
- Fed Kansas City. "Labor Constraints Driving Food Services Inflation." 2025.
Bond Market and Shadow Banking
- CNBC. "Credit Default Swaps Are in Demand Again." May 29, 2025.
- Charles Schwab. "Bond Market 2026: What Could Go Wrong?"
- Morgan Stanley. "Trump Fed Pressure: Investing Risks." 2025.
- Better Markets. "The Basis Trade: Financial Fragilities." April 2025.
- Financial Stability Board. "Global Monitoring Report on NBFI 2025." December 2025.
- Congressional Research Service. "NBFI and Capital Markets Policy." Report R48512.
Energy-Compute Nexus
- Pew Research. "Energy Use at U.S. Data Centers Amid the AI Boom." October 2025.
- International Energy Agency. "Energy Demand from AI." 2025.
- U.S. Department of Energy. "Electricity Demand from Data Centers." 2025.
- PV-Tech. "Tariffs to Increase Costs and Disrupt US Solar." 2025.
- Marketplace. "Why the US Is Losing the AI Energy Race to China." February 2026.
Theoretical Frameworks
- Blyth, Mark. Great Transformations: Economic Ideas and Institutional Change. Cambridge University Press, 2002.
- Blyth, Mark. Austerity: The History of a Dangerous Idea. Oxford University Press, 2013.
- Blyth, Mark, and Eric Lonergan. Angrynomics. Columbia University Press, 2020.
- Luhmann, Niklas. Social Systems. Stanford University Press, 1995.
- Habermas, Jürgen. The Theory of Communicative Action. Vol. 2. Beacon Press, 1987.
- Verovšek, Peter J. "Taking Back Control over Markets." Political Studies 71, no. 2 (2023).
- Lessig, Lawrence. Code and Other Laws of Cyberspace. Basic Books, 1999/2006.
- Knight, Frank. Risk, Uncertainty, and Profit. 1921.
FRED Series for Reader Verification
| Series | Description |
|---|---|
| DGS10 | 10-Year Treasury Constant Maturity Rate |
| DGS2 | 2-Year Treasury Constant Maturity Rate |
| T10YIE | 10-Year Breakeven Inflation Rate |
| FEDFUNDS | Effective Federal Funds Rate |
| PCEPILFE | Core PCE Price Index (YoY) |
| FYFSGDA188S | Federal Surplus or Deficit as % of GDP |
| CES1011330001 | Farm Employment, Seasonally Adjusted |
| THREEFYTP10 | 10-Year Treasury Term Premium |