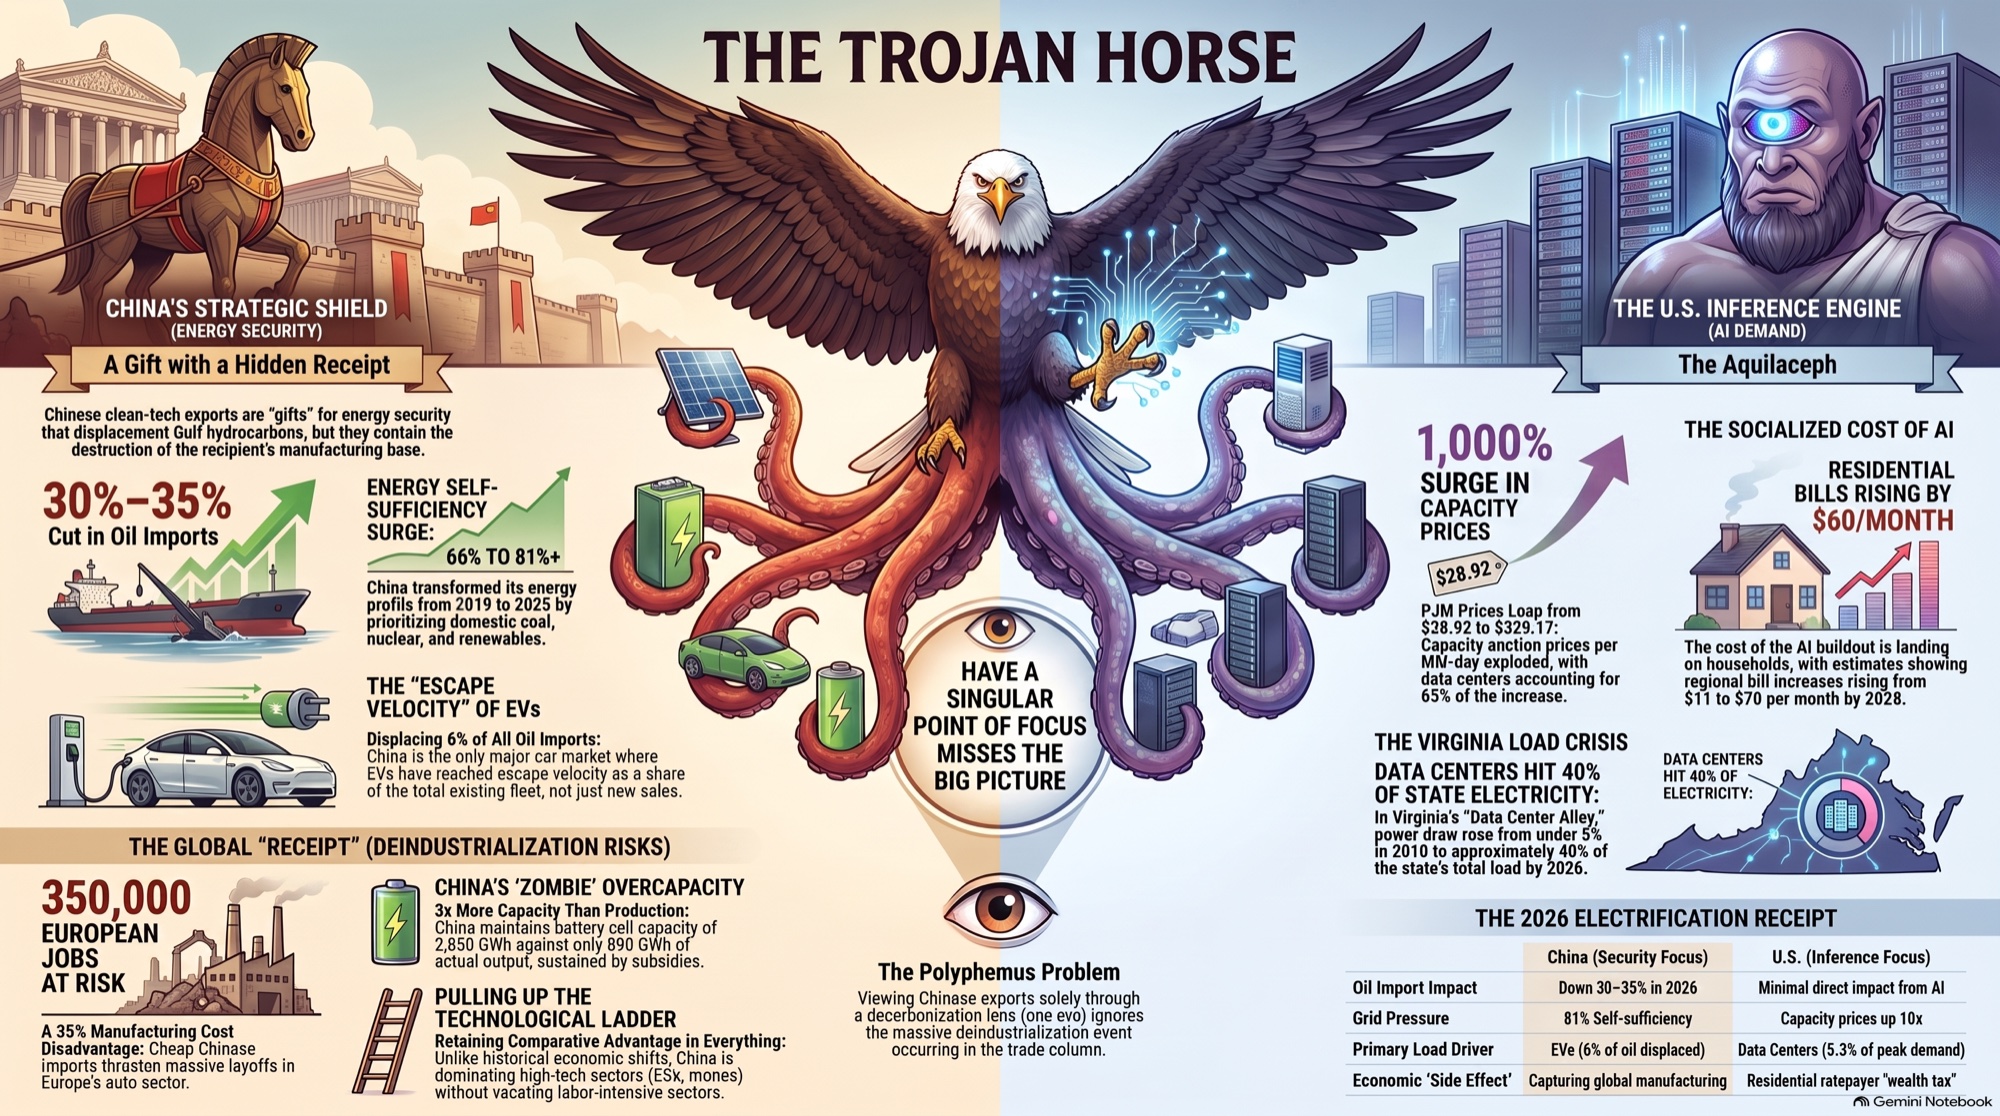
On August 12, Michael Cembalest published the Eye on the Market note that gives this article its subject. He called it “The Year of the Trojan Fire Horse.” The Fire Horse is 2026’s zodiac sign. Bold moves, self-reliance, speed. The Trojan Horse is the other half: a gift that arrives with something inside it.
The gift is Chinese clean technology. Batteries, solar modules, electric vehicles, sold below what anyone else can build them for. For an oil-importing country in the year the Strait of Hormuz closed, this is not a small thing. It is the difference between a fuel bill denominated in a war and one denominated in sunlight.
What is inside the horse is the rest of the manufacturing base.
The Receipt
Two electrification programs, running simultaneously, on opposite sides of the Pacific.
| Indicator | Reading | Context |
|---|---|---|
| Chinese oil imports, 2026 | Down 30–35% | In the year the Strait closed. Attribution is contested: reserve drawdown, coal gasification, and electrification, in unknown proportion. |
| Chinese energy self-sufficiency | 66% → 81% | 2019 to 2025, share of useful final energy from renewables, nuclear and domestic fossil fuels. Higher again in 2026. |
| Chinese oil demand displaced by EVs | 6% of oil imports | First half of 2026. The only major car market whose EV share of the existing fleet has reached escape velocity. |
| US data center power draw | 31 GW → 41 GW | 2025 to 2026. From 4.1% to 5.3% of total US peak summer demand in one year. |
| PJM capacity price | $28.92 → $329.17 | Per megawatt-day, 2024/25 to 2026/27 auction. Data centers accounted for 63% of one year’s increase, about $9.3 billion. |
| Data center share of Virginia electricity | <5% → ~40% | 2010 to 2026. One state, one grid, one load class. |
| Chinese battery cell capacity vs production | 2,830 vs 890 GWh | 2024. Capacity is roughly three times output. Solar modules: 1,045 GW capacity against 587 GW produced. |
| Chinese industrial firms operating at a loss | ~30% | Sustained through a period of negative producer prices by subsidy rather than cleared by competition. |
I. The Import Cut Nobody Can Fully Explain
The question Article 5 left open was why the physical disruption of a closed Strait did not arrive in the price the way the models said it would. Part of the answer is now visible, and it is not a market mechanism at all. It is an industrial policy that had been running for fifteen years and happened to mature in the right year.
China cut its oil imports by 30 to 35 percent in 2026. Cembalest attributes this to some combination of three things: drawing down strategic and commercial reserves reported to exceed one billion barrels, gasifying domestic coal to make petrochemicals through coal-to-olefins, and straightforward electrification of demand that used to burn liquid fuel.
The proportions are not known. Michal Meidan, who runs China energy research at the Oxford Institute for Energy Studies, calls the attribution “the million dollar question” and says plainly that “there’s a massive level of uncertainty because we don’t fully understand what has happened.”
This is worth sitting with. The single largest demand-side response to the largest supply disruption on record was executed by a state whose energy statistics are opaque enough that the best-informed outside analysts cannot decompose it. The world’s oil price in 2026 is a function of a number nobody can audit.
Official Chinese data shows 4.6% real GDP growth from 2022 through 2025. The Rhodium Group estimates the more plausible range at 1.5% to 2.0%. Both numbers are in circulation; the gap between them is roughly the size of the German economy.
II. What China Bought With Its Electrons
On the rate of change in the renewable share of useful final energy, and on the rate of change in electrification of final energy, China is moving faster than any other major economy, and considerably faster than the United States. Those two curves are what took energy self-sufficiency from 66 percent in 2019 to 81 percent in 2025.
Transport is where it shows most clearly. China is arguably the only major car market where electric vehicles have reached escape velocity as a share of the existing fleet, not merely of new sales. The Center for Research on Energy and Clean Air puts the displacement at 6 percent of Chinese oil imports in the first half of 2026 alone, across cars, buses, trucks and semi-trailers, in that order of maturity.
None of this makes China clean. Chinese coal consumption is still rising, and it is worth stating the scale precisely: China’s coal consumption alone exceeds the total energy consumption of any other country on earth, including the United States, India and all of Europe. About 55 percent of that coal goes to power generation. The rest is thermal heat and feedstock for petrochemicals and plastics, which is also, not incidentally, the coal-to-olefins route that let China substitute domestic coal for imported crude this year.
The point is not that China decarbonized. It is that China de-imported. Those are different objectives, and only one of them is a strategic asset when a strait closes.
III. What America Bought With Its Electrons
Over the same period, US data center power draw rose from 31 gigawatts to 41 gigawatts, taking data centers from 4.1 percent to 5.3 percent of total peak summer demand in a single year. Projections have them adding roughly 125 gigawatts of load and pushing overall US electricity demand growth to a 4.1 percent compound annual rate through 2030, the strongest four-year stretch since 2000.
The generation to serve it does not exist. Large gas turbines are substantially sold out through 2030, which is pushing developers toward on-site gas engines and pushing utilities toward extending the life of coal plants they had scheduled to close.
The price signal has already arrived, and it did not arrive at the data centers. PJM capacity prices went from $28.92 per megawatt-day in the 2024/25 auction to $329.17 in 2026/27. Analysis of the 2025/26 auction attributed 63 percent of the increase, roughly $9.3 billion, to data center demand. Typical residential customers in the region are seeing about $11.24 a month added in 2026, with estimates of roughly $70 a month by 2028.
In Virginia, data centers now consume something close to 40 percent of the state’s electricity, against under 5 percent in 2010.
AI capital cycle demands compute → compute demands firm power → firm power is sold out through 2030 → utilities extend coal and add on-site gas → capacity auctions clear an order of magnitude higher → the increase is socialized across the rate base → residential bills rise before a single token is served → ratepayers organize → projects are blocked in 49 states → the buildout’s binding constraint stops being capital and becomes consent
IV. Consent Becomes the Constraint
In the first quarter of 2026, opponents blocked or delayed at least 75 data center projects worth about $130 billion. Organized opposition more than doubled and now operates in 49 states. A January 2026 survey found nearly three quarters of Virginia voters blaming data centers for higher electricity costs.
Virginia’s State Corporation Commission approved a separate rate class for large-load customers in November 2025. From January 2027, those customers must cover at least 85 percent of contracted distribution and transmission demand and 60 percent of generation demand. That is the first serious attempt in the United States to stop socializing the cost of a private buildout, and it took a 76 percent price move to produce it.
Kara Swisher devoted an episode of On with Kara Swisher to whether data centers can be built without this outcome, convening Erin Brockovich alongside the Utah climate scientist Logan Mitchell, the Virginia organizer Elena Schlossberg, and Lansing mayor Andy Schor. The recurring theme was not electricity but disclosure, the nondisclosure agreements, the tax abatements negotiated before a community knows a project exists, the water. A large American data center can use on the order of five million gallons a day.
That Brockovich is the name attached to this is itself the signal. The frame moved from data-center siting to consumer protection, which is a different legal apparatus with a different burden of proof and a considerably better track record against capital.
V. The Gift
Now the horse. Chinese clean technology exports, batteries, solar photovoltaics, and electric vehicles, stepped up sharply after Russia’s invasion of Ukraine, and stepped up again after the American invasion of Iran this year. The correlation is not subtle. Every time the security premium on Gulf hydrocarbons rises, the market for Chinese equipment that displaces Gulf hydrocarbons rises with it.
For a country like Pakistan, this is straightforwardly good. Solar has gone from a rounding error to a meaningful share of electricity generation there, almost entirely on cheap Chinese imports, in a country that spends a punishing fraction of its GDP importing fuel.
For a country with its own automotive industry, the same gift reads differently. CLEPA and Roland Berger put 350,000 European jobs at risk by 2030 from Chinese competition, on a 35 percent European cost disadvantage driven by materials, labor and energy. That would come on top of roughly 104,000 European automotive jobs already eliminated across 2024 and 2025 by ZF Friedrichshafen, Bosch, Continental, Schaeffler and others. Around half of European automotive suppliers now say they will reduce investment in Western Europe over the next five years. Eleven of sixteen planned European battery factories have been delayed or cancelled.
New tariffs of 17 to 35 percent on battery electric vehicles did not stop it. Exports continued, and shifted mix.
The IEA counts over one million electric cars exported from China that have not been registered as sales in any importing country. Shipping accounts for some of it. The rest is inventory accumulating in destination markets, production that has left China’s balance sheet without yet finding a buyer.
VI. The Ladder
The developing world gets the sharper end. From 2021 to 2024, as Chinese manufactured imports into ASEAN rose, every ASEAN country except Brunei, Cambodia and Laos saw its manufacturing share of GDP decline. The US-China Economic and Security Review Commission counts dozens of Indonesian textile and garment firms shuttered with 250,000 jobs lost across 2023 and 2024 and another 280,000 at risk, and roughly 4,000 factory closures in Thailand across the same two years in appliances, furniture, electronics, garments, autos and steel.
Shoumitro Chatterjee and Arvind Subramanian give the structural version: China “is not merely climbing the technological ladder; it is pulling up the ladder behind it.” It has taken the commanding heights, electric vehicles, solar, batteries, and drones, without vacating the labor-intensive sectors through which poorer countries have historically escaped poverty. In their words, China is attempting “what economic theory says no country should be able to do: retain comparative advantage in almost everything.”
The measurement is stark. At the start of this century, China’s share of value added in apparel, textiles, footwear and leather exports from low- and middle-income countries ran about 35 percent, roughly its share of those countries’ population. It is now about two thirds of the total, while its share of the working-age population has fallen.
VII. The Balance Sheet Underneath
A sustained run of negative industrial producer prices should force consolidation. Capacity should exit. In China it has not, because roughly 30 percent of industrial firms are loss-making entities kept alive by a subsidy apparatus with no international peer. Fifty-eight percent of new Chinese bank lending is extended at or below the prime rate of 3 percent.
The result is capacity that bears no relationship to demand: 2,830 gigawatt-hours of battery cell capacity against 890 produced; 1,045 gigawatts of solar module capacity against 587 produced; 204 gigawatts of wind nacelle capacity against 96; 22 million units of electric car capacity against 12 million built. Roughly two to three times production across the board, which is not a cyclical overhang. It is a decade of low-cost exports already funded and already built.
China objects to the characterization. It filed a paper with the WTO in July titled “China’s position on the So-called Excess Capacity Issue.” Cembalest read it and reports being convinced by none of it.
The constraint is the customer. Logan Wright puts it as directly as it can be put: “an economy like China’s that is so dependent on global demand for growth cannot remain in perpetual conflict with its customers.” Anti-dumping and countervailing duty investigations against China have climbed steeply since 2023. Beijing has responded by threatening countermeasures against the EU’s Industrial Accelerator Act, issuing decrees authorizing retaliation against “discriminatory” foreign laws, and introducing outbound investment controls to create legal grounds for punishing countries that restrict Chinese capital.
VIII. Polyphemus
Cembalest reaches for the Odyssey twice. The Trojan Horse is the first. The second is Polyphemus, the cyclops, his point being that a single point of focus misses the picture. Read only the energy column and Chinese exports are an unambiguous decarbonization and energy-security win for every importer. Read only the trade column and they are a deindustrialization event. Both columns are correct. Neither is the whole.
Article 6 named the condition this series has been tracking: every actor operating rationally inside their own functional code, nobody rewarded for reading across codes, and an aggregate that no individual chose. The energy analyst who reports the solar share is not wrong. The trade economist who reports the job losses is not wrong. The utility regulator approving a large-load tariff and the pension trustee holding the data center debt are both discharging their duties correctly. The cyclops has excellent vision. He has one eye.
Here is what the codes miss when read separately. China and the United States are both electrifying at unprecedented speed, and they are buying different things with it. China is buying its way out of a chokepoint, converting an oil-import dependency into a domestic coal, solar and battery dependency, which is worse for the climate and better for the security position. The United States is buying inference, and it is buying it on a grid where the marginal cost lands on households that receive no part of the output.
Both programs are rational within their own code. One of them produces exportable industrial capacity that arrives in other countries as a gift. The other produces a capacity auction that arrives in Virginia as a bill.
The Fire Horse year is not over. Nolan’s Odyssey has crossed a billion dollars at the box office while critics catalogue its inaccuracies, which is its own small lesson about the relationship between a story’s reception and its fidelity. The gift horse is still being unloaded. What comes out of it depends less on the horse than on whether anyone is reading more than one column at a time.
Sources
Primary Source
- Cembalest, Michael. “The Year of the Trojan Fire Horse: China’s imbalanced economy and unrelenting mercantilism.” Eye on the Market, J.P. Morgan Asset Management, August 12, 2026. Source of the Trojan Horse and Polyphemus framing, the energy self-sufficiency and electrification series, the coal comparison, the capacity-versus-production figures, the subsidy and zombie-firm data, and the ASEAN and European displacement figures.
- Roach, Stephen. “How long can China defy history and logic with its imbalances?” Financial Times, July 22, 2026. The argument Cembalest’s note responds to.
Chinese Energy and Oil Demand
- Meidan, Michal, Oxford Institute for Energy Studies, quoted in Cembalest, August 12, 2026, on the uncertainty in decomposing China’s import cut.
- Center for Research on Energy and Clean Air. “EV-related oil cuts emerge as a new driver for China’s clean air progress.” July 14, 2026. EV displacement of Chinese oil demand.
- Energy Institute and IEA data via JPMAM, 2025, for renewable share, electrification share and self-sufficiency series.
- Rhodium Group estimate of 1.5–2.0% plausible real GDP growth 2022–2025 against the official 4.6%.
US Grid and Data Center Load
- US Energy Information Administration, January 13, 2026: strongest four-year growth in US electricity demand since 2000, attributed to data centers.
- IEEFA on PJM capacity market pricing and the data center share of the increase.
- Virginia State Corporation Commission, November 2025, large-load rate class: 85% of contracted distribution and transmission demand, 60% of generation demand, effective January 2027.
- Belfer Center, “Data Centers and Large-Scale Electric Growth: The Virginia and Texas Experiences.”
- Goldman Sachs and Bloom Energy 2026 power reports for the 31 GW to 41 GW load figures and the gas turbine backlog through 2030.
Community Opposition
- On with Kara Swisher, “Can Data Centers Be Done Right,” with Erin Brockovich, Logan Mitchell, Elena Schlossberg and Mayor Andy Schor. On secretive deals, tax incentives, water use and whether guardrails are possible.
- Reporting on 75 projects worth ~$130 billion blocked or delayed in Q1 2026, and organized opposition across 49 states.
- January 2026 Virginia polling on attribution of electricity costs to data centers.
Trade Displacement and Overcapacity
- CLEPA / Roland Berger. “Competitiveness gap: manufacturing in EU threatened by displacement.” November 24, 2025.
- US-China Economic and Security Review Commission, 2025 Annual Report to Congress, Part IV, Chapter 8, “China Shock 2.0.” Indonesian and Thai closures; Chinese FDI and technology transfer.
- Chatterjee, Shoumitro and Arvind Subramanian. “China is pulling up the ladder behind it.” Foreign Affairs, June 18, 2026.
- Wright, Logan. “China’s moment of weakness.” Foreign Affairs, July 23, 2026.
- IEA capacity and production figures, 2025. OECD MAGIC database on industrial subsidies, June 1, 2026.
This Series
- The Bond Market Doesn’t Bluff (Article 5). Social Physics.
- Article 6. Social Physics. Distributed invisibility, cross-code perception, and the original Odyssey framing.
- The Stack. The compute layer taken apart floor by floor, including the power bill.
- Twenty Percent. The Domestic Machine. The energy weapon read through the war pipe.